Waterloo Urban Growth and Change Fall 2016 Research Symposium
The Symposium
On November 22, 2016, the Urban Growth and Change Research Group held a research symposium on the work the group had conducted thus far as part of two SSHRC-funded projects. The leading question was “can improved understanding of buyer, seller and developer preferences help us meet our intensification goals?”
During the symposium, Professor Dawn Parker, Principal Investigator of the projects, introduced the background of the research projects and summary of results from completed student theses, including Emma DeFields on yard preferences, Jason Neudorf on employment accessibility and Kevin Yeung on household travel resources allocation. Former students Robert Babin and Jinny Tran presented the results from their theses on home value influencers and developer preferences. Margaret Parkin, the Region of Waterloo’s manager of Planning Research and Analytics, presented on the ION light rail transit monitoring project.
The video documents the presentation section of the symposium. To view the recording, click on the appropriate tab below.
The symposium also included information on our other research into property preferences, development of a household travel resource allocation model, and measuring access to employment. Click a tab below to read more about each thesis.
Video Recording of the Symposium
An overview of completed projects starts at 4:30, the discussion of home value influencers starts at 12:46, an overview of developer preferences at 28:20, a discussion of future research objectives at 55:00, and an overview of the Region’s ION light rail transit monitoring program at 1:03:45.
Video: Urban Growth and Change Research Group Fall Symposium: November 22, 2016 from Waterloo Complexity Institute on Vimeo.
Property Size Preferences and the Value of Outdoor Space - Emma DeFields, 2013
To view a poster version of the content, click here.
Introduction
In 2012, DeFields surveyed 206 residents of the Kitchener-Waterloo area, living in homes with private yards, on their landscaping and property size preferences and future housing plans. Her work analyzed who might be attracted to high-density living and tradeoffs between private and public open space. For the purposes of this study, high density is defined as single-detached dwellings on small lots, townhouses, condominiums, and apartments; while low density is defined as single-detached houses on medium to large lots. Similar surveys were conducted in 1995 and 2004 under the supervision of Dr. Roger Suffling.
What density do people prefer?
As people age their preferences for housing changes – young couples with children tend to prefer single-detached dwellings with access to private yard space, while retired couples may be interested in smaller homes with little to no private yard. Once above the age of 45 years old, preference begins to shift towards higher density living. Those without children and in every income group, except those in the $75,000 to $99,000 bracket, have a preference for both low and higher density residences. Those in the $75,000 to $99,000 bracket have a greater preference for low density.
When do people plan to move into a new home?
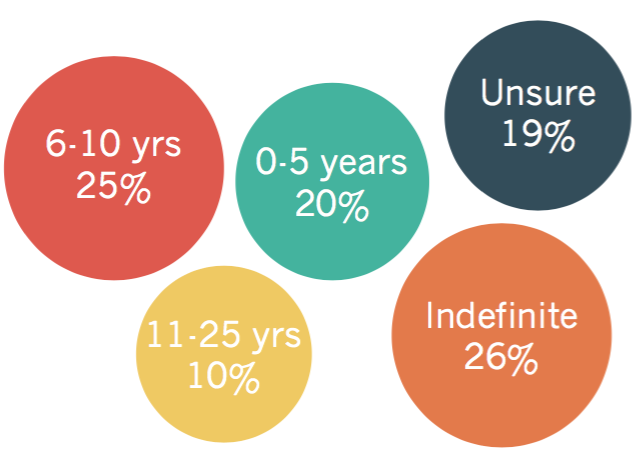
What is the most desirable home size given the current home size?
For those living in small homes – less than 1000 square feet:
- Most would prefer to upsize to a medium sized home
- Others would like to remain in their current small home
- The majority plan to move in the next 10 years
For those living in medium homes – less than 2500 square feet:
- Most would prefer to stay in the same size home
- About a quarter (¼) plan to stay indefinitely, while the majority will move in the next 10 years
- They desire private greenspace if they were to downsize to a smaller home
For those living in large homes – greater than 2500 square feet:
- Most prefer an equally sized home, but would move into a medium sized home
- Most plan to stay much longer in their current home, than small and medium sized homeowners
- Those older than 65 years express a desire to downsize to a small home with private greenspace
What are the most attractive landscape styles?
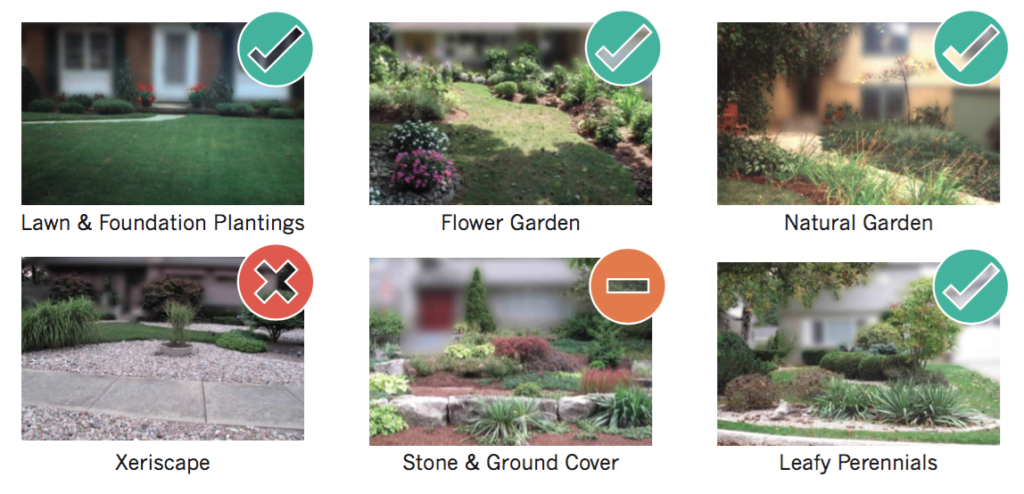
The landscape styles with the most appeal to people are:
- Lawn and foundation plantings
- Flower gardens
- Natural gardens
- Leafy perennials
The stone and ground cover style received mixed feedback, while xeriscapes were generally disliked.
How do people use their yard space?
How people use their front yards:
- Gardening
- Car parking
- Good views
- Watching the street
- Lawn care
- Talking with neighbours
How people use their back yards:
- Relaxing
- Outdoor dining
- Reading
- Hosting parties
- Good views
- Play area for children
- Viewing wildlife
What is important to people when they have no yard:
- Having a nice view
- Close to a park or forest
- Having a private porch or balcony
- Walking distance to an urban centre
- Sense of privacy
How can we make higher density living more attractive?
- Market high density living to aging populations – those 55 years and older
- Incorporate private greenspace into higher density living
- Design open spaces to accommodate private yard uses
- Preserve urban forests, parkland, and open spaces
- Use attractive landscape styles around buildings and in open spaces
Interested in learning more? The complete thesis can be read at http://hdl.handle.net/10012/7778
Understanding Job Accessibility: A New Policy Paradigm and Tool - Jason Neudorf, 2014
To view a poster version of the content, click here.
Introduction
Accessibility reflects the ability of individuals to reach their destinations, given interactions between transportation systems, land use, and individual resources. Neudorf used data from the 2006 Transportation Tomorrow Survey (TTS), to develop a new tool to calculate how accessibility to jobs varies by transportation mode and location, and how cost compare across these modes. The Transportation Tomorrow Survey (TTS), is survey of travel habits and socioeconomic factors, conducted in the municipalities of the Greater Golden Horseshoe. Each municipality is divided into smaller Transportation Activity Zones (TAZ) to perform analysis.
What is Accessibility Profile Analysis?
Accessibility Profile Analysis (APA) calculates how many jobs could be reached for a given cost ($) using the least cost travel mode. “Generalized Costs” include dollar estimates of the time spent traveling, and fixed costs of travel (ie. fares, gasoline). “Reachable destinations” are the number of accessible jobs for a particular transportation cost. The curves can show areas underserved by transit, identify areas with higher transportation “barriers to entry” to the local job market, and find neighbourhoods that have poor employment access and/ or infrastructure deficiencies.
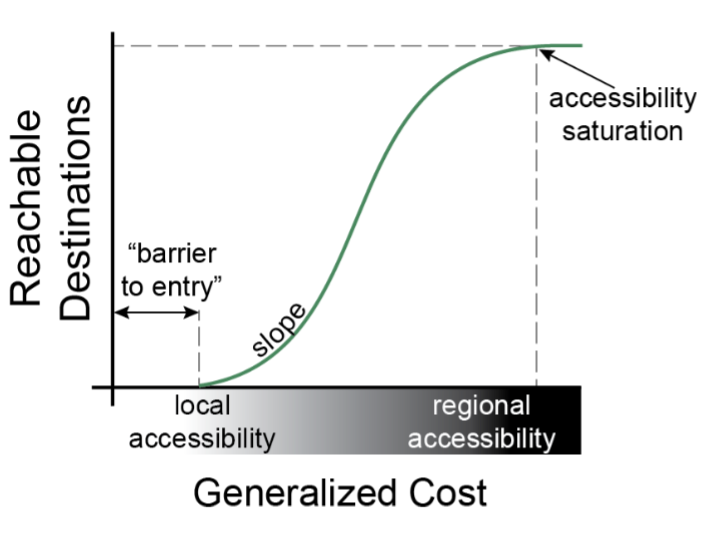
Potential Uses of Accessibility Profile Analysis
When examining different travel modes, the maximum access profile can be calculated. This metric can be used to decide the best travel mode for reaching the most jobs at a particular cost. This can help people make better travel choices, and aid policymakers in addressing low-income or vulnerable group access to the local job market. For example, in the chart below, walking is the most effective travel mode for shorter trips, then transit, and finally driving for longer trips. However, the area under these lines provides an indication of the overall maximum level of accessibility.
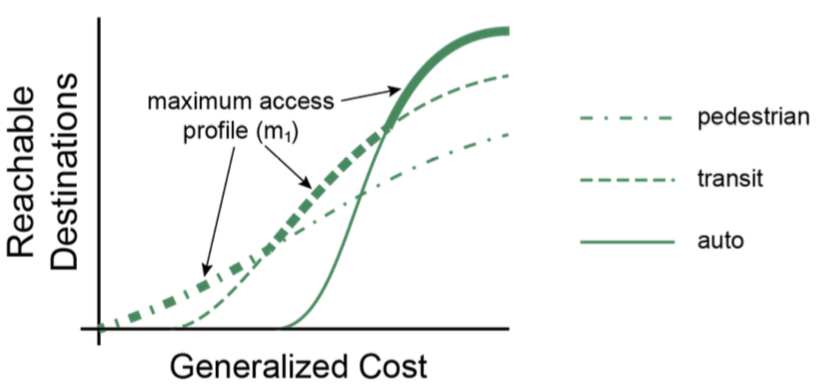
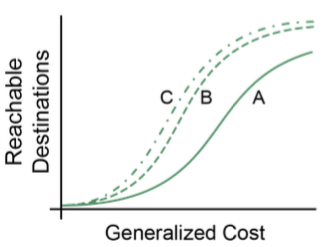
APA can also be used to assess the potential impact of different transportation policy and infrastructure decisions. For example, it could be used to evaluate the best mode type for a new transit system – A) bus, B) light rail, or C) subways. By examining the curves, the number of accessible destinations can be calculated at a particular function of cost and time – the generalized cost.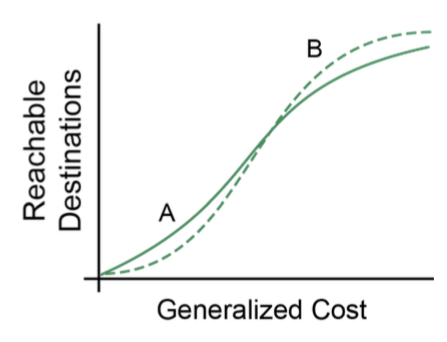
It could also be used to determine the impacts of a policy change – A) local bus service, or B) express bus service. In this example, the localized bus service provides more accessibility earlier, but is overtaken by express service when looking at longer trips. Overall, APA provides an excellent policy tool to assess accessibility to not only jobs, but also potentially parks, grocery stores, or another key socioeconomic feature.
Application of Accessibility Profile Analysis – Employment Access in Kitchener-Waterloo
An interactive version of the tool has been created to explore employment access in Kitchener-Waterloo for 2006. To explore this sample use case, click here
Interested in learning more? The complete thesis can be read at: http://hdl.handle.net/10012/8759
Developing a Travel Scheduling and Resource Allocation Model - Kevin Yeung, 2015
To view a poster version of the content, click here.
Introduction
Yeung surveyed 14 Kitchener-Waterloo residents about their travel behaviours, daily schedule, and balance of mandatory activities (work or school that must be done that day) and discretionary activities (service, shopping, recreation or social that could be done another day). He created a model of how households make trip decisions and when they may need to postpone or cancel activities due to household resource limitations. This could be from a lack of adult to accompany a dependent, or poor transit service, or the lack of a car.
Key Concepts
A trip is individual travel from one place to another place. A tour is a sequence of trips chained together to best use available resources. Dependents (ie. children) are people that may require accompaniment by an independent (ie. parents) to some or all of their activities. Each household has a set of shared resources for travel to activities such as money, time, vehicles, dependents and independents. The household must choose an appropriate transportation mode using the available resources. These modes include:

Model Inputs
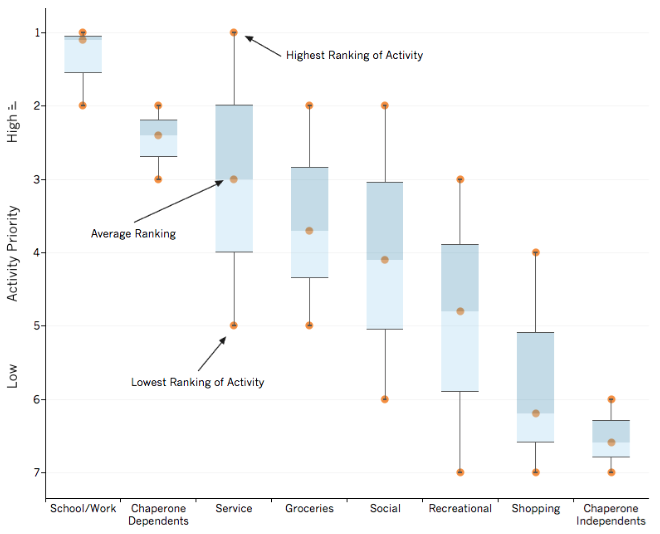
The model requires two inputs: travel demand and travel resources. Travel demand is influenced by the number and type of people in the household, the number of mandatory and discretionary trips that they need to take, and the locations of their home and trip destinations. Travel resources are the types of transportation available to a household to use – auto, transit, cycling, walking. They also include the individual members’ ability to travel on their own, and the time constraints to reach destinations. The model also accounts for the prioritization people assign to certain activities. For example, school or work is a mandatory activity that has a very high priority, while recreation and leisure is a lower priority discretionary activity. The chart below summarizes the results of survey questions about prioritization of activities.
An example:
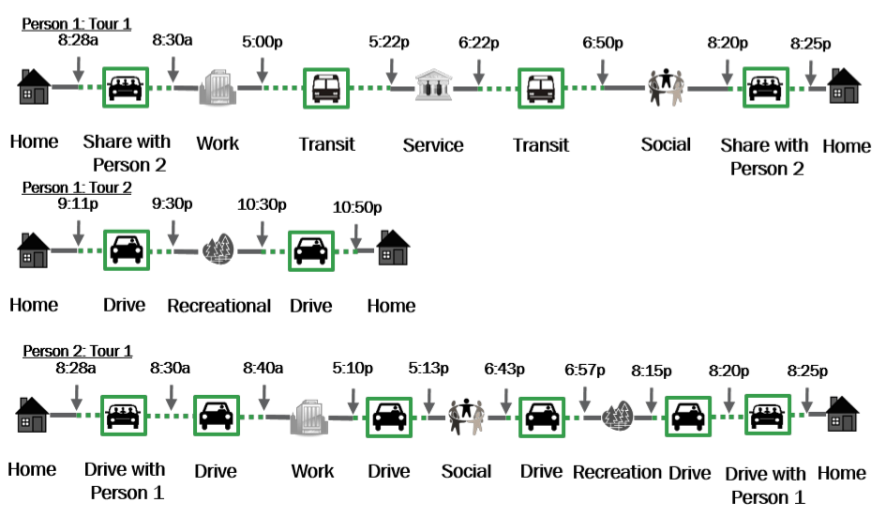
A household has two adult members, with access to one vehicle and a transit pass for each member. Person 1 has a mandatory activity and three discretionary activities. Person 2 has a mandatory activity and two discretionary activities (see table below).

The model then calculates the most cost effective and time efficient modes of travel, schedules the trips to reach destinations within the allowable times, and then looks to chain together trips into a tour. For example, Person 2 drives Person 1 to their job, and then continues to their own workplace location.
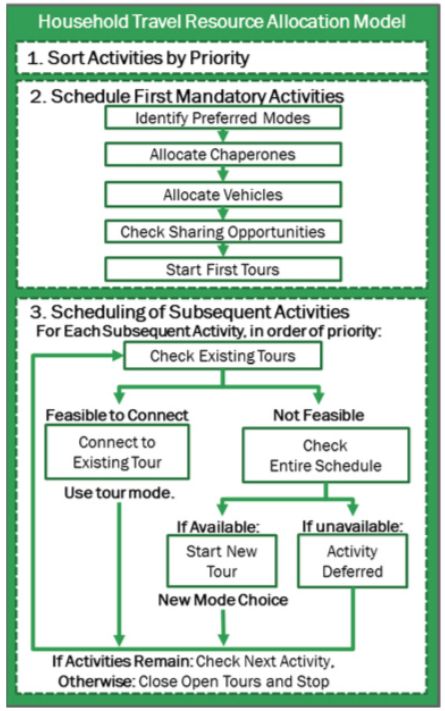
Final Output of Model – An Optimal Travel Schedule
How is this useful?
This model can be applied to diverse household structures. The enhancement of public transport – the Region’s iXpress and LRT systems – could provide new options so that households can take more discretionary trips that improve quality of life and lower transportation cost. As cities grow, a better understanding of travel behaviour will help planners and engineers make more informed decisions
for land use plans and infrastructure investments.
Interested in learning more? The complete thesis can be read at http://hdl.handle.net/10012/9705
Hedonic Modelling of Open Space and Multimodal Transit Amenities - Robert Babin, 2016
Intensification is the preeminent growth management approach in Ontario, as well as across much of North America. Under this approach, the Region of Waterloo is currently constructing a light rail transit system and undertaking co-ordinated planning to support population and employment densification alongside other regional goals. The work presented in this thesis is centred on the development of spatially explicit hedonic models to estimate residential preferences for amenities associated with intensification. The results of this work are to be used as willingness-to-pay parameters in an agent-based land use-transport model. The hedonic models presented in this thesis use 26,873 Kitchener-Waterloo residential property sales from 2005 to 2015 to estimate the joint effects of willingness-to-pay and willingness-to-accept for housing. Combined spatial lag and spatial error models are employed to test the effects of environmental home characteristics on assessed and appreciation-adjusted transaction values, for single-detached homes, semi-detached and duplex homes, and townhouses. These models are specified to estimate effects related to the changing built form and housing market under intensification; specifically, this work estimates the price effects associated with access to public and semi-public open space, access to public transit (local bus stops), and walkability throughout the period preceding light rail. A large number of socioeconomic control variables were developed and analyzed to determine an appropriate model specification. Heterogeneous willingness-to-pay estimates are presented for intensification amenities within and outside of the Central Transit Corridor throughout three time periods. Models using assessed values and transaction values provided slightly different but comparable results. Results suggest a positive willingness-to pay effect of walkability for single-detached homes and semi-detached and duplex homes. However, walkability was found to only significantly relate to townhouse value through a synergistic interaction with open space and a negative interactive effect with transit. The regional Central Transit Corridor generally saw greater increases in property value due to walkability and in general throughout the implementation process of regional light rail, compared to homes outside of it. The results of this thesis may be used to help inform policies and investments related to housing, public amenity distribution, and multimodal transit planning. While the precise estimates produced in this work are context-specific, broadly, these results can provide guidance in other municipalities and land-markets similarly undergoing intensification.
To read the complete thesis visit: http://hdl.handle.net/10012/10936
Understanding Developer's Decision Making in the Region of Waterloo - Jinny Tran, 2016
From the data collected, we analyzed developers using a self-identified typology: greenfield, infill, and student housing developers. Through a combination of literature, in-person interviews, and primary data analysis of the responses from 18 developers (17 residential, and 1 non-residential), the findings show that the three sub-classes of developers exhibit their own distinct characteristics and behaviours on certain matters, but are similar for others.
In general, greenfield developers tend to develop single- use, low-rise developments, and their primary target markets are families or first-time home buyers. Infill developers are generally interested in mixed-use, mid to high-rise projects targeting a range of demographics that are attracted to the Central Transit Corridor (e.g. young professionals, empty nesters, and investors). Finally, student housing developers focus on either higher density developments or maintain existing low- density residences that concentrate near the Northdale neighbourhood or post-Secondary institutions; they are also interested in expanding beyond the saturated student housing market.
To read a summary of the findings, click here.
Region of Waterloo Central Transit Corridor Monitoring Program
To view a poster version of this content, click here. To learn more about the Region’s monitoring efforts of ION light rail transit, click here.
The Waterloo Urban Growth and Change Research Group is part of the University of Waterloo School of Planning, supervised by Dr. Dawn Parker. To learn more about the Waterloo Area Regional Model project, visit http://research.wici.ca/projects/warm/

